SforD Data Solution for Forestry
How we delivered onboard computers, a mobile app and BI-ready data for forestry contractors, on time and on budget, with 95% adoption and reporting time halved.
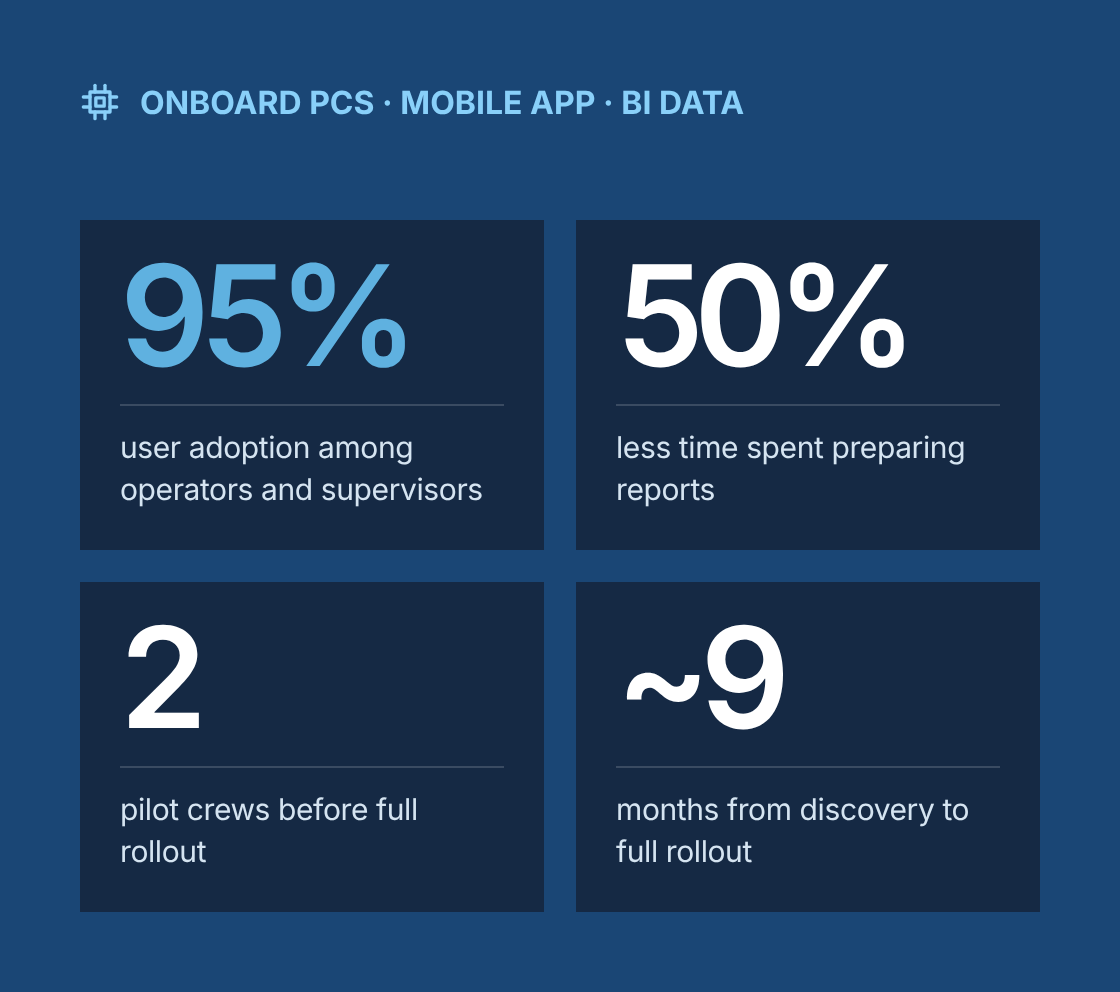
- 95% user adoption among operators and supervisors
- 50% less time spent preparing reports
- 2 pilot crews validated the workflow before full rollout
- ~9 months from discovery through pilot to full rollout
Project at a glance
- Client
SforD, a US forestry operations company coordinating harvesting and forwarding work through independent contractor crews - Solution
Onboard computers in forestry machines, an offline-capable mobile app for supervisors and crews, secure data transfer to a central server, and BI-ready datasets for performance reporting - Engagement
Business analysis and delivery coordination, delivered remotely from Canada with scheduled field visits - Duration
About 9 months, from discovery through pilot to full rollout - Our role
Lead business analyst and delivery coordinator, working with the client's operations leadership, a hardware vendor, mobile and backend developers, and a BI developer - Scope
Requirements, data design, field deployment coordination, integration oversight, testing and rollout support across multiple contractor crews
The challenge
What problem was the client trying to solve?
Supervisors had no timely view of what was happening in the field, so performance problems were found weeks after they started.
- Paper records retyped at the office
Production volumes, machine hours and downtime were recorded on paper or in end-of-shift texts and retyped into spreadsheets at the office. - Reports days or weeks late
Reports reached managers days or weeks late, often with gaps and inconsistent units between crews. - No shared production record
Contractors and supervisors disagreed about production figures because there was no shared, trusted record. - Downtime causes rarely captured
Machine downtime and its causes were rarely captured, so maintenance and scheduling decisions relied on memory. - Weak or no signal on site
Most work sites had weak or no cellular coverage, which ruled out any solution that needed a constant connection.
Our business analysis approach
How did we approach the engagement?
We started from the decisions supervisors needed to make, worked back to the data that would support them, and only then defined hardware, app and integration requirements.
- Discovery and field observation
We interviewed operations managers, supervisors, contractor owners and machine operators, and observed shifts on active harvest sites. We mapped the as-is reporting process in BPMN, from data capture in the cab to the weekly management report. - Decision and KPI definition
With operations leadership we agreed the questions the system had to answer: production per machine hour, utilization, downtime by cause, and progress against block plans. Each KPI was given a formula, data source, owner and refresh frequency. - Business and technical requirements
We documented business requirements, user stories with acceptance criteria for the mobile app, and non-functional requirements for offline operation, data security, sync reliability and ruggedized hardware. - Data design
We defined the data model and a data dictionary for machine events, production records, downtime codes, crews, blocks and contractors. Downtime and activity codes were standardized across all crews before any build started. - Integration and data flow design
We specified a store-and-forward pattern: data is captured on the onboard computer or mobile device, held locally, and transferred securely to the central server whenever a connection is available. Specs covered payload structure, encryption in transit, retry logic, duplicate handling and error logging. - Field deployment coordination
We worked with the hardware vendor and contractor crews to plan installation of onboard PCs, scheduled around harvest operations to avoid lost production time, and tracked each machine through installation, configuration and sign-off. - Testing and pilot
We wrote test scenarios from the acceptance criteria and ran end-to-end tests from cab to report, including no-signal and intermittent-signal conditions. A pilot with two crews validated the workflow before full rollout. - Rollout and adoption
We prepared short role-based guides for operators and supervisors, ran on-site walkthroughs, and collected feedback during the first weeks of use to fix friction points quickly.
Solution
What did we deliver?
Component
Problem
What was delivered
Onboard computers
No reliable record of machine activity
Ruggedized onboard PCs installed and configured on harvesting and forwarding machines to capture operating hours, activity status and production data
Mobile app
Paper forms and end-of-shift texts
Offline-capable app for operators and supervisors to log production, downtime with standard cause codes, and shift notes
Data transfer
No connectivity at most sites
Secure store-and-forward sync to a central server, with retry handling, duplicate checks and transfer logs
Central data store
Data spread across spreadsheets
Consolidated database with validated, consistently coded records for all crews and machines
BI datasets
Reports built by hand each week
Cleaned, modelled datasets ready for BI dashboards on production, utilization, downtime and block progress
Master data
Inconsistent names and codes between crews
Standard lists for crews, machines, blocks, contractors, activities and downtime causes
Data quality controls
Gaps and errors found late
Validation rules at capture and on load, with an exceptions report for missing or out-of-range records
Documentation
Knowledge held by a few people
Data dictionary, KPI definitions, integration specs and user guides
Governance
How did we manage requirements and delivery?
Every requirement was traceable from the business decision it supported through to tested, deployed functionality.
- A requirements traceability matrix linked business requirements to user stories, data elements, test cases and deployment milestones.
- KPI definitions and the data dictionary were signed off by operations leadership and treated as controlled documents.
- Scope changes went through a simple change request process with impact on schedule, budget and dependent components noted before approval.
- Weekly status reviews with the client, the hardware vendor and the development team tracked milestones, risks and open decisions.
- A risk log covered field-specific risks such as installation delays during peak harvest, device damage and connectivity failures, each with an owner and a mitigation.
Which BA techniques and tools did we use?
Techniques
- Stakeholder analysis
- Interviews and field observation
- BPMN process modelling
- KPI definition
- User stories with acceptance criteria
- Non-functional requirements
- Data modelling and data dictionary
- Integration specification
- Requirements traceability
- Risk management
- Pilot and UAT planning
Tools
- Jira
- Confluence
- Microsoft Visio
- Excel
- SQL Server Management Studio
- Power BI
Results
What were the results?
- 95% user adoption among operators and supervisors
- 50% less time spent preparing reports
- 2 pilot crews validated the workflow before full rollout
- ~9 months from discovery through pilot to full rollout
- 95% user adoption among operators and supervisors
- 50% reduction in reporting preparation time
- Delivered on schedule and within budget.
- Near real-time visibility of production, utilization and downtime once devices synced, instead of reports arriving days or weeks later.
- One shared record of production that contractors and supervisors could both rely on, reducing disputes over figures.
- Downtime captured with standard cause codes, giving maintenance and scheduling teams data to act on.
- A clean, documented data foundation the client can extend with new dashboards and metrics.
“
Lessons learned
What can other field operations teams learn from this project?
- Start with the decisions the data must support. Hardware and app choices are easier once the KPIs are agreed.
- Design for no connectivity from day one. Store-and-forward is a core requirement in remote operations, not an edge case.
- Standardize codes for activities and downtime before building anything. Otherwise the reports will never line up across crews.
- Plan field installations around the operating calendar. Lost production time during rollout erodes support for the whole project.
- Run a short pilot with real crews. It surfaces usability issues that no office workshop will find, and it builds the adoption you need for rollout.
Is your field data arriving weeks too late?
Talk to a senior business analyst about capturing reliable data in the field, even without a signal, and turning it into reports your managers can act on.
SforD Data Solution for Forestry
Project Description
The SforD data solution initiative aimed to equip forestry contractors and supervisors with a system to monitor operational performance in real time. The project included deploying onboard computers, developing a mobile application, configuring secure data transfers to a central server, and preparing datasets for business intelligence reporting. This fully integrated solution enhanced visibility into operations, simplified reporting, and empowered faster, data-informed decisions. The project was delivered on schedule and within budget, achieving a 95% user adoption rate and cutting reporting preparation time by half.
Delivered Value
- Captured and documented both business and technical requirements to guide implementation
- Coordinated the installation and configuration of onboard PCs in the field
- Designed workflows for seamless data transmission to a centralized server
- Structured data pipelines to support BI and performance reporting
- Managed the entire requirements lifecycle from discovery to deployment
- Facilitated ongoing communication with stakeholders to align expectations
- Monitored integration of hardware with digital systems for smooth functionality
- Oversaw delivery timelines and key milestones to ensure project success